Engineer Research and Development Center - Environmental Laboratory

Risk and Decision Science Team

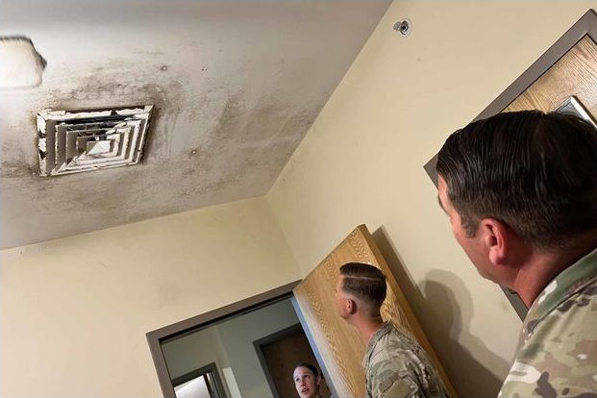
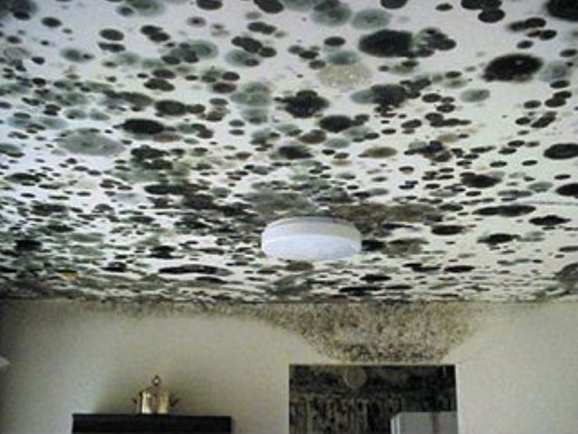
Building Mold and Moisture Risk

DESCRIPTION

Provide risk-informed decision support to installations with reference to building condition monitoring for mold and moisture related problems.


Problem

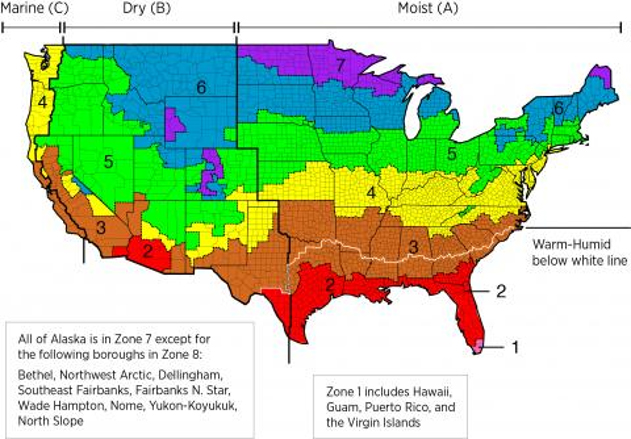
A large portion of DoD’s building portfolio lies in hot, humid climates (high risk region). Elevated moisture levels are one of many stressors causing degradation of building condition and performance. While moisture concerns are addressed in current criteria (e.g., Section 2-5.3.1 of UFC 1-200-02), such issues are climate sensitive, and can be undermined by climate change. Efficient precautionary monitoring for moisture problems is challenged by considerable spatial and temporal heterogeneity of moisture problems across an installation’s building stock and even within individual buildings.

A color USA zoning map showing zone 1 (pink) southern tip of FLorida. 2 (red) mostly Florida and Gulf coastline into southern Texas plus southern Nevada. 3 (brown) the southern states from the lower part of North Carolina to the southernmost portion of New Mexico, a chunk of southern Arizona and most of California. 4 (yellow) from the south half of New Jersey, Maryland, Virginia, northern North Caroline, Tennessee, Kentucky, south portions of Indiana, Missouri, and Kansas, the panhandle of Texas, a strip through the center of New Mexico and spots in Arizona, California, and western Oregon and Washington. 5 (green) covers south New Hampshire, Massachusetts, Rhode Island, Connecticut, most of New York, eastern West Virginia, most of Pensylvania and Ohio, south Michigan, north Indiana, Illinois and the top of Missouri, northwest Kansas, eastern Colorado, north New Mexico, northeast Arizona, most of Utah and Nevada, the top portion of Californai, eastern Oregon and Washington and portions of western Idaho. 6 (blue) covers most of Main, New Hampshire, Vermont, upper New York, a small part of Pennsylvania, north Michigan, Wisconsin, south Minnesota, southern North Dakota, most of South Dakota, Montana, Wyoming, and bits of Idaho and below. 7 (violet) covers the north tip of Maine, northern parts of Michigan, Wisconsin, Minnesota, North Dakota and small portions of Wyoming and Colorado.

Three logos arranged vertically. From the top is the seal for the USA Department of Defense with the eagle in the center, then the Builder logo with blocks. Below is the Welder logo with a pentagram shape with deep blue and grey shapes inside.

Solution

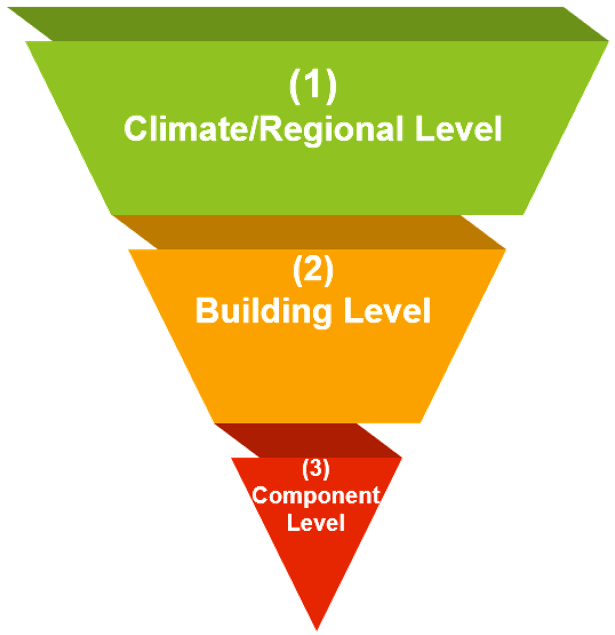
We set three technical objectives:

  1. Develop a risk-based building prioritization methodology to inform efficient moisture-related monitoring decisions in DoD building stock.
  2. Integrate the prioritization methodology with BUILDERTM SMS in order to leverage available DoD building data for risk assessment, inform data needs that can be fulfilled through future BUILDERTM condition assessment, and to export moisture-risk information to be considered along-side BUILDERTM outputs in sustainment management.
  3. Develop relationship(s) between climatic variables, mold growth potential, and facility condition indices—and incorporate into WELDER’s Distress Association Matrix.

Screening for Mold Risk Factors

  • Three tier risk factor screening:
    • Tier 1 High-level: Climatological factors (temp, humidity)
    • Tier 2 Mid-level: Combine w/ bldg. details on ventilation & AC to narrow down
    • Tier 3 Low-level: Identification of likely problem areas within bldg.
A triangular upside down pyramid shape. The largest portion at the top is light green and reads (1) Climate/Regional Level, the middle part is yellow-orange and reads (2) Building Level. The pointed triangle at the bottom is in red and labeled (3) Component Level.
A brown circlular field with white text reading Inspection Comment Processing (ML) with the Builder logo on a white rectangle beneath.
  • Use Machine Learning (ML) to ID risk factors based on BUILDER inspection comments

Tier 1: Modeling Climate Conditions

  • Challenge: Realistic simulations of temperature and relative humidity time-histories
  • Raw weather stats (mean and standard deviation) insufficient—doesn’t capture correlations
  • Crucial for mold growth simulation:
    • Autocorrelation - variation of temp and dew point temp from one hour to the next
    • Correlation between temperature (T) and dew point temperature (Td)
  • This work has been submitted for publication, led by Sergey Vecherin (CRREL) with contributions from Madison Smith and Matt Joyner (EL-RaDS)
A blue oval at the top reads Exterior Climate. THis has a fat green arrow pointing to a rounded rectangle below. Inside of this rectangle is from left to right, the cover of a paper, Criteria for Moisture-Control Design Analysis in Buildings; the Builder logo; and then the cover of a guide titled 2015 Standard for Performance Rating of DX-Dedicated Outdoor Air System Units. The rectangulare shape has another fat green arrow pointing to a blue oval beloe that reads Interior Climate.

Tier 2: Building Level

  • Translate exterior conditions to interior conditions using simplified models & basic building information (BUILDER):
    • Building size
    • Ventilation
    • AC (moisture removal)
    • Moisture sources (e.g., occupants)
  • ASHRAE 160 “Intermediate Method” : simple mass balance accounting for ventilation and moisture sources
  • Addressing moisture removal (AC) separately

We can use Machine Learning to identify buildings with “Problematic Characteristics” through Mold-Specific Data Mining.

Tier 3: Building Inspection

  • Detailed in-person inspection to identify high-risk buildings for mold
  • Identify components/areas with mold
    • Location
    • Materials
    • Interior/exterior
  • Update BUILDER Condition Index (CI) curves
  • Record all data needed to inform detailed analysis for intervention planning
  • Inform sensor placement for continued monitoring

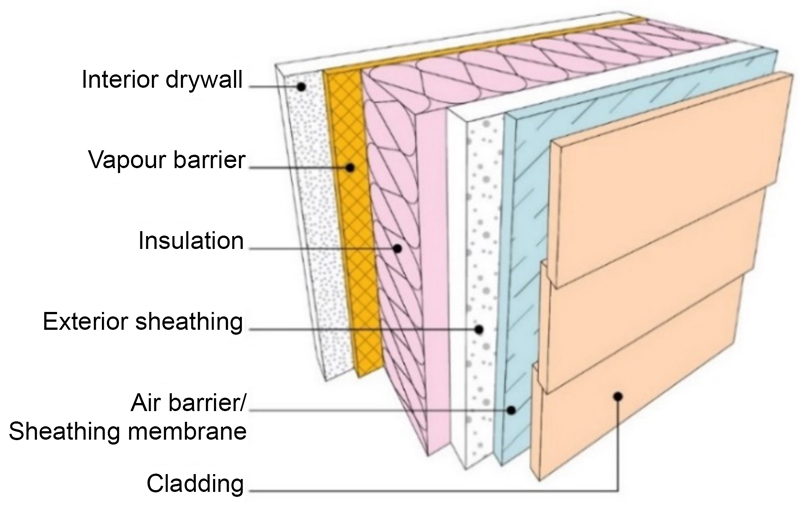
Component Materials of Concern for Mold

  • Anything material that is organic in nature and contains carbon for mold to use as a food source
    • Paper on gypsum board
    • Adhesives used for baseboards
    • Pastes used for wallpaper
    • Resins
    • Dust
    • Paper on fibrous insulation
    • Wood Products
    • Carpet

Component Areas to Inform Sensor Placement

  • Plumbing
  • Crawl Spaces
  • Ductwork or Pipes in Slabs
  • Basements
  • HVAC Ducts
  • Other Areas of high condensation
Photo of two men looking up at a ceiling vent with mold growth on the vent and ceiling.
Photo of a white ceiling with a white glass lighting fixture and the upper portion of a tan wall and doorway. The ceiling and portions of the top of the wall concentrated at the top of the doorframe are completely covered in large circular patches of various shades of green and black mold.
A graph titled Lifecycle Condition Trend with the y-axis labeled CI (condition index) delineated from 0 at the origin to 100 in 20 point increments. The y-axis is labled Year and is marked from 1990 at the origin to 2020, in 5 year increments. A red line labeled Adjusted Condition Trend curves down from the upper left at 100 down to 40 in 2007, then gradually beginning to recover but still dropping to 0 by 2020. Inspection Points 1 (1994), 2 (1998), 3 (2002) and a large cicrcle labeled Adjusted Service Life in 2007 at 40 are marked along the red line. A rectangular box is drawn across from 40 and down to 2007 at the Adjusted Life Service point. Inside the box is a horizontal dowble ended arrow reading SL = 17 yrs. A dotted line follows the red line just to the right and above it, labeled Initial condition Trend.

Impact

  1. Mold Prevention is key! Mold needs active water, carbon source, and favorable temps.
    • Ambient humidity not managed
      • Materials with low moisture capacity
      • Improper ventilation
    • Sources of moisture accumulation
      • Design flaws
      • Defects
      • Degraded Condition
      • Plumbing leaks
  2. Possible Next Steps
    • Model moldy components in detail to explore intervention alternatives
      • Detailed simulation of moisture and temperature distribution in interior spaces
      • Hygrothermal modeling of wall sections

A drawing showing building layers from the Interior Drywall, then a Vapour Barrier, then Insulation, then Air barrier/ Sheathing membrane, and finally Cladding.
A color 3-D diagram of a room labeled HVAC Supply with blue arrows pointing down into ducting. The top left has transparent arrows labeled Solar Load based on location, date and time. The righ hand appears to be possibly windows with awnings and blue arrows curving up towards the building labeled Ambient Conditions (Temperature, Humidity and wind speed. The room interior floor is colored from a violet along the left-hand wall on the solar condition side to red to orange to a lighter orange. Red regions extend up the walls by windows. A bar scale shows Predicted Mean Vote 1 [-] and a bar from -3 (blue) to light blue to green to yellow to orange to 3 (red). A second bar is labeled Percentage of Relative Humidity [-] and goes from black (10) to violet to red to orange to yellow to white (60).