Engineer Research and Development Center - Environmental Laboratory

Risk and Decision Science Team

FLEX Hospital Infrastructure Resilience to ‘Perfect Storm’ Pathogen Events

DESCRIPTION

Adapt tools from COVID to other stressors and integrate public health considerations in the design of military facilities (e.g., installations, VA hospitals, etc.) that would be resilient to future compounding threats. ERDC and USACE have been engaged in the response to epidemiological concerns. There have been shortages in supplies and services needed to treat hospitalized patients or process the surge of disease-related deaths, particularly the protective equipment necessary for staff working in healthcare, fatality management, and related industries. There is a need to develop predictive tools for the forecasting of demand and subsequent allocation of limited resources by responsible agencies.


Problem

  1. How can we develop a predictive model to forecast pediatric ILI outpatient visits, flu outpatient visits, and flu hospitalizations using historical data?
  2. Which exogenous variables (i.e., environmental conditions, population density, vaccination rates) are indicators of potential pediatric ILI and flu surges?
  3. How do weekly ILI/flu hospitalization forecasts compare to hospital bed capacity at the state- and national-levels?

Solution

Question 1: Developing a predictive model

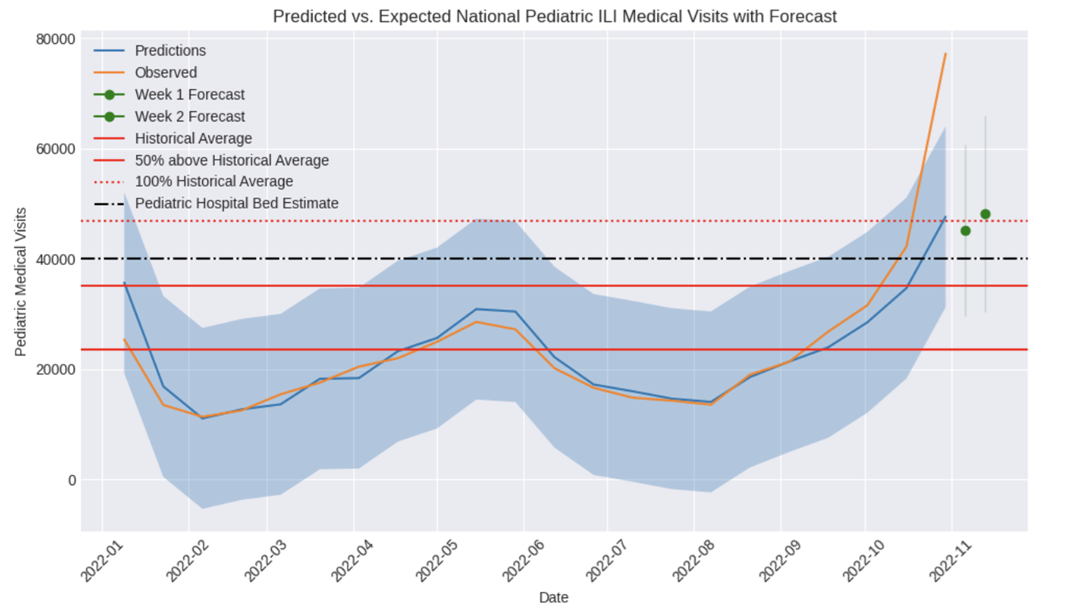
Model One: One week forecast

In our first model, we aim to predict patient surges one week ahead using historical data. The primary output variable represents the data for the following week.

Model Two: Two week forecast

In our second model, we extend the prediction horizon to two weeks ahead. To accommodate this, we create a new output variable which essentially represents the data for two weeks into the future by shifting forward one week.

Graphic with white outlines text ovals. The left side is titled National-Level Model. On the left is a vertical stack of 6 ovals reading (from top to bottom) Temporal Autoregressors, Weekly % of positive flu tests: Type A, Weekly % of positive flu tests: Type B, Yearly R0 Flu Transmission Rate, Weekly mean AQI, and Weekly Mean PM2.5. Each of these ovals have blue arrows pointing to a single right hand oval with the text: ILI Outpatient Visits, Flu Outpatient Visist, Flue Hospitalizations. The right hand section is titled State-Level Model and has the same stack of 6 ovals. Each of these point to the same right hand oval, but now there are 3 more ovals to the right of that one with the text (from top to bottom): Yearly population density, Yearly % of total population, and Yearly % of total pediatric population with a disability. these three ovals point bacl to the laft single one.

Question 2: Which variables are indicators

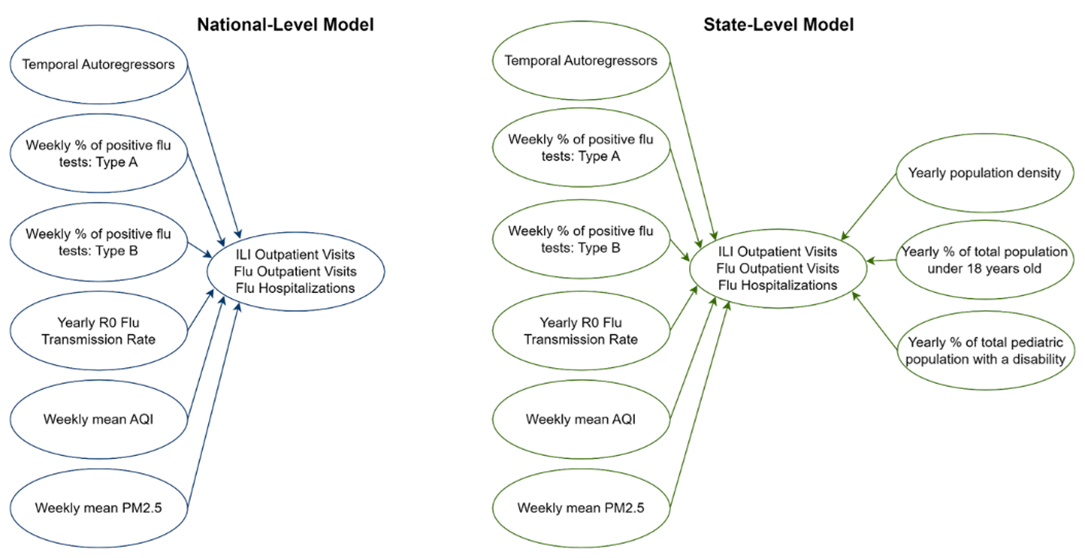
Provides rankings of a models features based on their influence on model predictions

Both models utilize relevant covariates such as "month" and "dominance (perc a, perc b)" (for ILI Visits) or "AQ" (for Flu Visits and Flu Hospitalizations) to enhance prediction accuracy.

National State
Outcome Top Covariates Outcome Top Covariates
ILI Visit Strain Dominance & Month ILI Visit Strain Dominance & Month
Flu Visit Air Quality Indicators & Month Flu Visit Population measures & Month
Flu Hospitalizations Air Quality Indicators & Month Flu Hospitalizations Population measures & Month


Question 3: Comparing weekly ILI/flu hospitalization forecasts to hospital bed capacity

A line graph titled Predicted vs. Expected National Pediatric ILI Medical Visits with Forecast. The y-axis is labeled Pediatric Medical Visits from 0 to 80k by 20k increments. The x-axis is labeled date from Jan 2022 to Nov 2022, by one month increments. There is a key: blue solid line - Predictions, orange solid line - Observed, Green dots for Week 1 and Week 2 Forecast, lighter red solid line - Historical Average, red solid line - 50% above Historical Average, dotted orange line - 100% Historical Average, and a black dotted dashed line - Pediatric Hospital Bed Estimate. The trends show that predicitions and observed trend fairly closely together until Novemeber when there is a steep unexpected increase in the observed rate.