Engineer Research and Development Center - Environmental Laboratory

Risk and Decision Science Team

Hurricane Support Tool and HES Modernization

DESCRIPTION

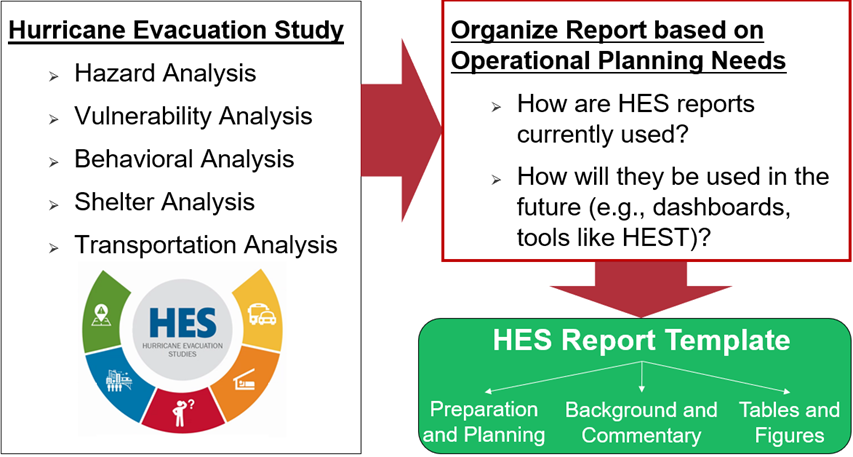
Develop the Hurricane Evacuation Support Tool (HEST) to support real-time decision making for emergency managers and planners. Assist the National Hurricane Center (NHC) in modernizing their development and presentation of Hurricane Evacuation Studies (HES) to make them more accessible, efficient, and effective for emergency managers at all levels of government. Modernization also focused on streamlining the HES process to make it easier to update with new results from Hazard Analysis, Vulnerability Analysis, Behavioral Analysis, Sheltering Analysis, and Transportation Analysis.


Goal

Hurricane Evacuation Studies (HES) are only updated a couple years at a time, how do we determine which States are prioritized in updating their Hurricane Evacuation Planning. Additional updates need to be made to the HES reports, how to update them for the future?

Graphic with left section titled Hirricane Evacuation Study. Bullets below read: Hazard Analysis, Vulnerability Analysis, Behavioral Analysis, Shelter Analysis, and Transporation Analysis. Beneath is a grey circle with HES Hurricane Evacuation Studies with colored arcs around the majority of it with icons of bus and car, shelter, a person with ?, a dam, and a caution icon popping up from a field. There is a fat red arrow pointing to the right side red rectangle with the title Organize Report based on Operational Planning Needs. Below are bullets How are HES reports currently used? and How will they be used in the future (e.g., dashboards, tools like HEST). A fat red arrow points down to a green field titled HES Report Template with thin white lines pointing within that fild pointing down to text: Preparation and Planning, Background and Commentary, and Tables and Figures.

A table titled Evacuation Zone, then Scenario A, B, C, D, E, F, ... X's are marked in the zones.

Solution

1) Evacuation Zones and Scenario

  1. Introduce scenarios used to delineate evacuation zones
  2. Present mapping matrix to pinpoint which zones should be evacuated given a scenario

2) Evacuation Participation

  1. Describe how participation rates are estimated
  2. Discuss significance of socioeconomic breakdown and cite population data sources
  3. List all underlying assumptions
A partial map image titled North Carolina Survey Areas. A key shows East and Southeast Zones from deep green to pale, and deep blue to pale. Green zones stretch across the top of the mape and blue at the bottom.
A map with the inset key titled Maine Transportation Network. The legend shows a black dot for Endpoint, thin red line for Minor Arterial, thick red line for Major Arterial, and then black line for County Boundary. A network of thin and thick red lines show transportation routes. Logos are on the bottom of the legend for USACE, FEMA, ?, NOAA, and City of Orinda.

3) Evacuation Clearance Times

  1. Describe how Clearance Times are calculated
  2. Discuss models, tools, and assumptions
    1. Network Analysis
    2. Software
  3. Discuss special circumstances or scenarios (e.g., lane reversals)
  4. Discuss limitations of models

4) Shelter Demand

  1. Describe reasoning and studies behind assumed rate(s) for shelter participation
  2. Discuss factors that influence shelter participation rates
  3. Socioeconomics
  4. Vulnerability
  5. Messaging
  6. Set minimum reporting standards
  7. Cite all studies/sources that influenced assumed participation rate(s)
A red timeline shows tE (Evacuation order issued based on expected Clearance Time), tL = 0 (Evacuation Sheltering), tPI (Shelters transition to Post-Impact status (~3 days)), and tTH (Shelters transition to temporary housing (17~33 days)). The red line is labeled time, t (days). double sided arrows depict Evacuation Sheltering between tE and tPI, and Post-Impact Sheltering from tPI to tTH.

5) Shelter Capacity

  1. Describe shelter inventory databases and where the information comes from
  2. Discuss any state-level regulations
  3. Vertical evacuation?
  4. Close shelters inside evac zones?
  5. Count on neighboring states' capacity?