Engineer Research and Development Center - Environmental Laboratory

Risk and Decision Science Team

Lifecycle Management of Natural Infrastructure and Savannah River Sediment Budget

DESCRIPTION

In collaboration with researchers at University of Georgia, a partner of the Network for Engineering With Nature, this project is developing and demonstrating a lifecycle management framework to support comparison of natural and conventional flood risk management measures. The researcher team is also developing a sediment budget for the Savannah River to quantify the availability of sediment that could be available to build and sustain coastal natural infrastructure.

Project Links


Problem

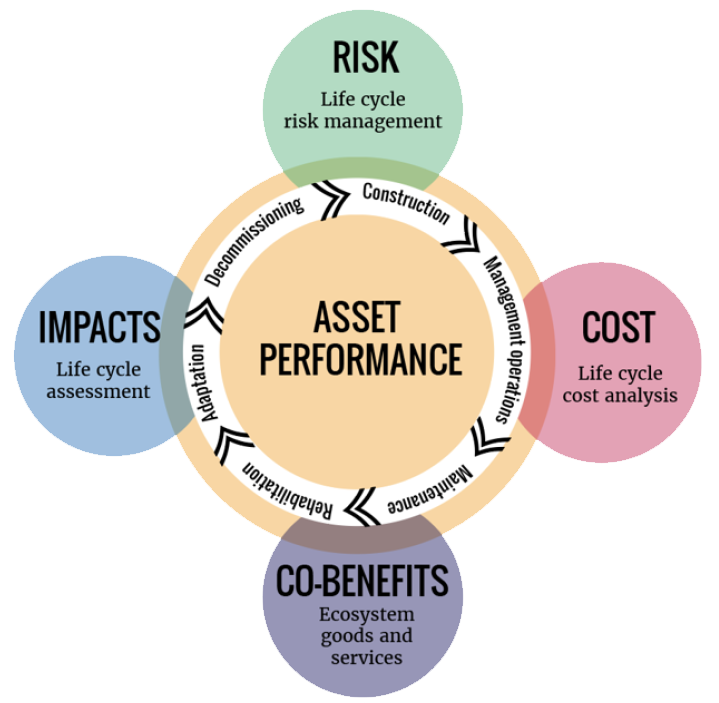
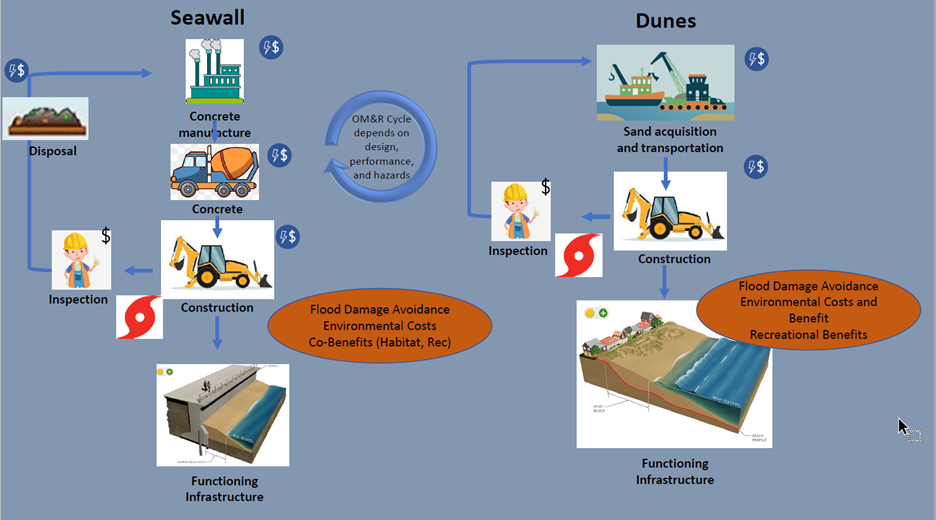
The need to develop and demonstrate a lifecycle management framework to support comparison of natural and conventional flood risk management measures.

Two sets of graphics on a blue background. THe left side is titled Seawall and the right is titled Dunes. Under seawall is Concrete Manufacture with an arrow pointing down to Concrete then arrow down to Construction then arrow down to Functioning Infrastructure. A second arrow points left from Construction to Inspection then up to Disposal and back around to Concrete manufacture.  In the center is a circular arrow with the text OM&R depends on design, performance, and hazards and then an orange oval with the text Flood Damage Avoidance Environmental Costs Co-Benefits (Habitat, Rec).  Below Dunes is Sand acquisition and transportation and an arrow pointing down to Construction then arrow down to Functioning Infrastructure. A second arro points from Construction to Inspection then back up to Sand Aquisition and transportation. An orange oval reads Flood Damage Avoidance Environmental Costs and Benefit Recreationsl Benefits.

Drawing titled Development of a Sediment Budget: Savannah, GA, shows from the upper left, a rever load coming down to a reservoir, then to a port, then confined containment and opening to t larger body of water with Barrier Islands along the shore. THe center has text: dredgin of ship channel and Dune restoration beach nourishment. Typed text point to the river load point with What is the load delivered by floodplain erosion vs bed erosion vs what is escaping dams. Another typed text at the top right points to the larger water body and reads How much sediment moves alongshore from the north? A third typed area point to the juntion of the river to the large body and reads How much sediment moves into lower harbor from ocean. The logo of the University of Georgia Institure for Resilient Infrastructure Systems is at the bottom.

Solution

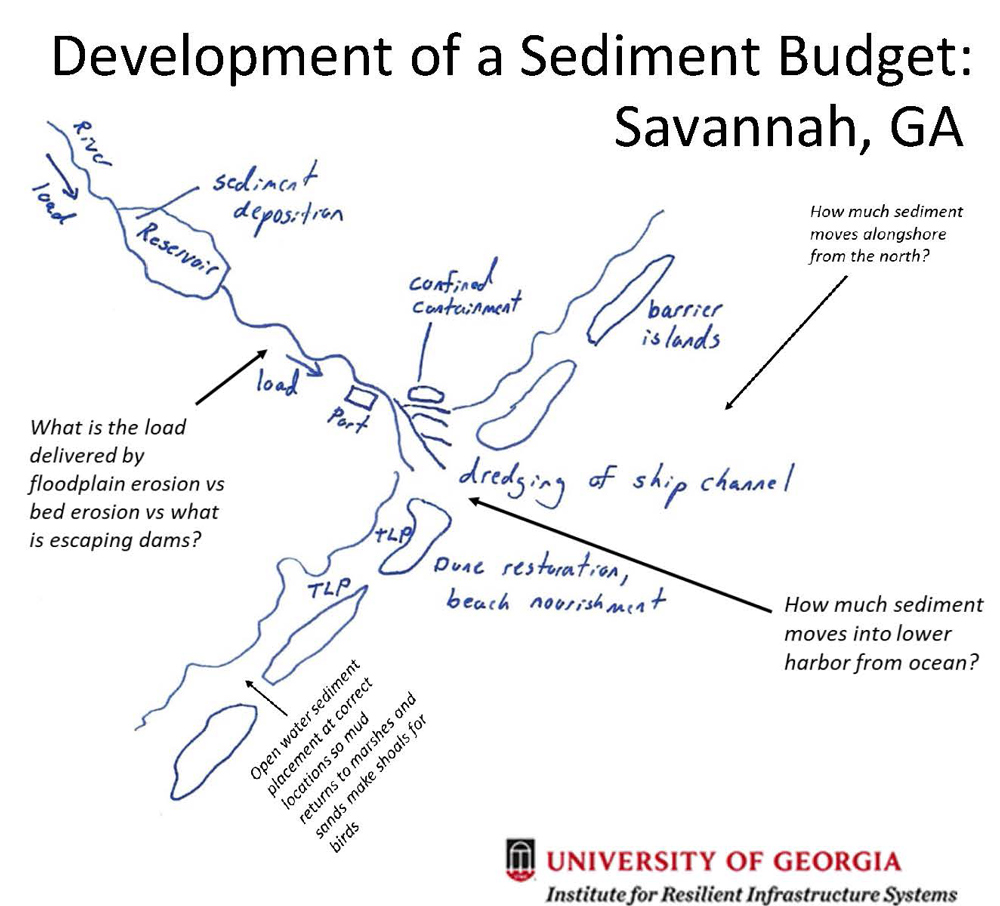
Developing a sediment budget for the Savannah River to quantify the availability of sediment that could be available to build and sustain coastal natural infrastructure.


Impact

Nature-based or natural infrastructure solutions enhance the functions of naturally occurring landscape features that provide valuable services to people and society, such as minimizing damages from floods and shoreline erosion.

Line graph with y-axis labeled Benefit Accrual from Low (origin) to High. The x-axis is labeled Time. The key shows a black line for Periodic fluctuation moderate volatility benefit accrual, dotted blue line for Fast acting: high volatility benefit accrual and yellow line for Slow ramp: low volatility benefit accrual. The black line does a squiggly general rise from low to high. The dotted blue has a upward trend with lots of high and low points. The yellow line has a gentle upward swoop.
A series of circles with text. In the center is Asset Performance on yellow surrounded by a white band with Construction, Management operations, Maintenance, Rehabilitation, Adaptation, and Decommissioning. Above is a green circel with Risk: Life cycle risk management. To the right is a red circle with Cost: Life cycle cost analysis. To the left is a blue circle with Impacts: Life cycle assessment. Below is a violet circle with Co-Benefits: Ecosystem goods and services.