
Engineer Research and Development Center - Environmental Laboratory
Risk and Decision Science Team
Integrating Moisture Vulnerability and Monitoring Prioritization into Existing DoD Building Stock Sustainment Management
Provide risk-informed decision support to installations with reference to building condition monitoring for mold and moisture related problems. Develop approach for updating building condition index for DoD buildings in the BUILDER database to inform lifecycle analysis and maintenance/repair/retrofit decisions.
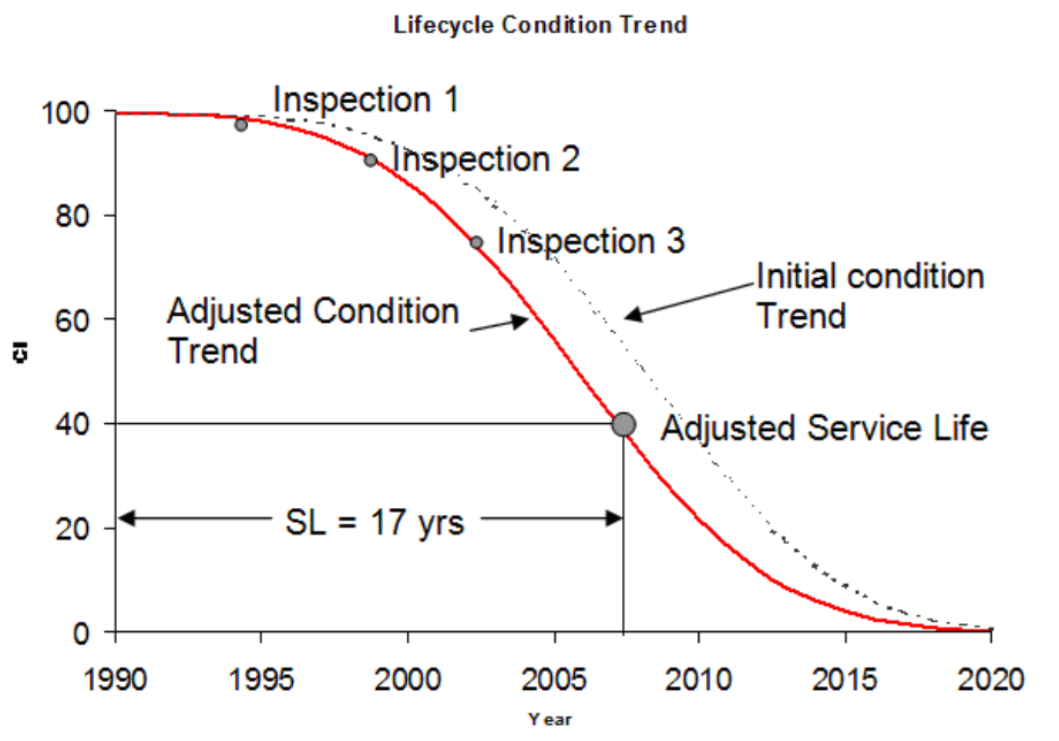
There are various stressors that act on a building over the course of its useful life and cause degradation of condition and performance, but one of the most impactful is elevated moisture levels. The optimal building façade designs to control the movement of water, air, water vapor, and heat at the time of construction may no longer be suitable 20 years in the future as local climates change. Climate risk will cause some asset lifecycle trajectories to deviate from their expected course and sustainment investment strategies will need to be adapted accordingly.
To inform decisions about long-lasting capital investments in DoD’s global building portfolio, it is important to understand the scale and implications of the evolving risk from moisture and integrate it into existing condition assessment and facilities sustainment, restoration, and modernization planning. A hybrid approach for detecting current and future problems is needed to target monitoring and subsequent activity according to the risk of moisture problems occurring. Leveraging existing data, methods, and processes for building design, construction, assessment, and asset management will help us better understand the scale of moisture-related vulnerability and to prioritize high risk buildings for monitoring.
Leverage data from BUILDERTM, the established DoD facility condition assessment and prediction software, and incorporate new predictive information to extend its use for moisture problems. Proactively identify candidates for recapitalization work in a building prior to more costly degradation or failure occurring. A moisture vulnerability index will be developed to convey the likelihood that moisture problems will arise because of exposure to conducive conditions and susceptibility to moisture issues such as mold growth. Outputs will be used to inform prioritization of buildings for more detailed inspection and monitoring.