Engineer Research and Development Center - Environmental Laboratory

Risk and Decision Science Team

Network Resilience

DESCRIPTION

The RADS team is serving as government evaluators for this DARPA project, where our expertise in network science and in the resilience of complex systems helps this ground-breaking effort to address critical supply chain problems.

https://www.darpa.mil/program/resilient-supply-and-demand-networks

The Department of Defense (DoD) has a critical need to secure its sources of materiel against both intentional—including adversarial—and unintentional disruptions. Extensive global networks of private-sector vendors, commonly called “supply chains,” collaborate to provide these key resources, including precursor components and materials. The Resilient Supply-and-Demand Networks (RSDN) program adopts the phrase “supply-and-demand network” (SDN) in lieu of “supply chain” to emphasize that the strategic challenges are more extensive than the logistic challenges of delivering (“supplying”) materiel.

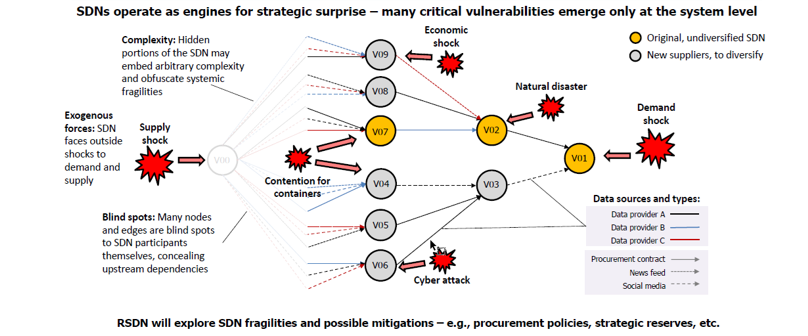
SDNs are open, complex, evolving systems whose dynamics reflect the impact of both external factors (e.g., conflict, climate change) and internal behaviors (e.g., inventory management). These factors are often driven by the locally focused decisions of SDN participants themselves. The economic forces of globalization have historically emphasized SDN efficiency (cost and timeliness) over SDN resilience (response to shocks). SDN resilience is a characteristic of the SDN system as a whole. Resilience enhancements, therefore, require coordinated action among SDN participants, who may individually lack the incentive and discretion to undertake this complex process.

SDNs are potential sources of strategic surprise for the DoD. Surprise in the context of SDNs is rarely beneficial. Key underlying sources of SDN surprise are:

  • Imperfect knowledge of the current structure of the SDN itself;
  • Difficulty in predicting different kinds of shocks from the wide landscape of threats and vulnerabilities; and,
  • Difficulty in predicting changes in the SDN due to endogenous behavioral shifts, which can be amplified abruptly and dramatically through feedback effects.

To expose and mitigate these sources of surprise, RSDN will develop novel information resources and practical analytical tools, including:

  • Granular, up-to-date maps of SDNs, identifying individual providers (network nodes) and their specific trading relationships with each other (network edges);
  • Augmentation of the basic network maps with detailed organizational features describing the nodes and detailed descriptions of the procurement relationships governing the edges;
  • A broad and extensible set of analytical tools for exploring fragilities (threats and vulnerabilities) in SDNs; and,
  • Techniques for stress testing SDNs by specifying and simulating their responses to exogenous shocks and endogenous feedback.

Problem

Disasters, both natural and man-made, can cause disruptions to infrastructure and strategic networks.

Graphic titled SDNs operate as engines for strategic surprise - many critical vulnerabilities emerge only at the system level. On left: 3 text bulrbs. Blurb 1: Complexity: Hidden portions of the SDN may embed arbitrary complexity and obfuscate systemic fragilities. Blurb 2: Exogenous forces: SDN faces outside shocks to demand and supply. Supply Shock. Blurb 3: Blind spots: Many nodes and edges are blind spots to SDN participants themselves, concealing upstream dependencies.  The center section has circles with V09, V08, V07, V04, V05, V06. to the left is red star shape labeled: Contention for containers. Arrows point from V08 and V07 to V02 then to V01. Arrows from V04, V05 and V06 point to V03 then to V01. A red star labeled: Natural disaster points in to V02. A red star labeled: Cyber attack points in to V01 and the connection to V03. A red star labeled: Demand shock points to V01. V07, V02, and V01 are yellow which means Original, undiversified SDN. The remainder are grey which are New suppliers, to diversify. Another key shows Data sources and types: solid black line as Data provider A, solid blue line as Data provider B, Solid red line as Data provider C, solid grey arrow as Procurement contract, dotted grey arrow as News feed, and dashed grey arrow as Social media. A sentence at the bottom reads RSDN will explore SDN fragilities and possible mitigations - e.g., procurement policies, strategic reserves, etc.

Solution

Modeling and quantifying disruptions, subsequent system responses, and the overall results for system functionality. Recommending strategies for future responses to disruptions as well as planning initiatives that are poised to enable easier and faster recovery in the future.

Three graphic elements. The top left is a series of grey dots with blue arrows. Mine 1 points to Refinery 1 (which has a dotted red circle around it) which points to Electrical Component Manufaturer which points to Infotainment System Manufacturer which points to an unlabeled dot on the right. Below Mine 2 points to Refinery 2 which points to Battery Manufature which points to Battery Pack Manufacture which points to the same right most unlabeled dot.  Below this grouping is a yellow oval with a small line graph with y-axis labeled Counts and x-axis labeled Time-to-complete (TTC). A key shows yellow is Normal TTC propensity and blue is Disrupted TTC propensity. The yellow line jumps immediately then drops quickly and levels out. The blue line slowly rises after a delay then slowly levels out. This yellow oval has an arrow pointing up to the Battery Manufacture dot above.  To the right of these is another line graph titled Rate of On-Time Completion (smoothed) Intervention: On Critical Path. The y-axis is Completion Rate from 0.1 at the origin to 0.9 at the top in 0.1 increments. The x-axis is Inflation Factor from 0 (origin) to 10 in increments of 2. The key is for Intervention Node. Blue is No intervention, orange is INTECH CABLE INC CAROLINA WIRE & CABLE DIV, green is AMES GOLDSMITH CORP, red is ARCO ALLOYS CORP, violet is AMG TITANIUM ALLOYS & COATINGS, and brown is Intervention on Two Nodes. All of the lines are jagged and go from the top left at 0.9 and slowly drop as they approach the Inflaction factor of 10. The slowest drop is brown (2 nodes) ending with a completion rate above 0.3. Next is a close race between orange, red, violet and green, all ending with an completion rate about 0.2. Last is blue (no intervention) which ends in a completion rate around 0.1.

This is an unlabeled image of blue and red lines demonstrating network connectivity with red, blue, yellow and green node dots.

Impact

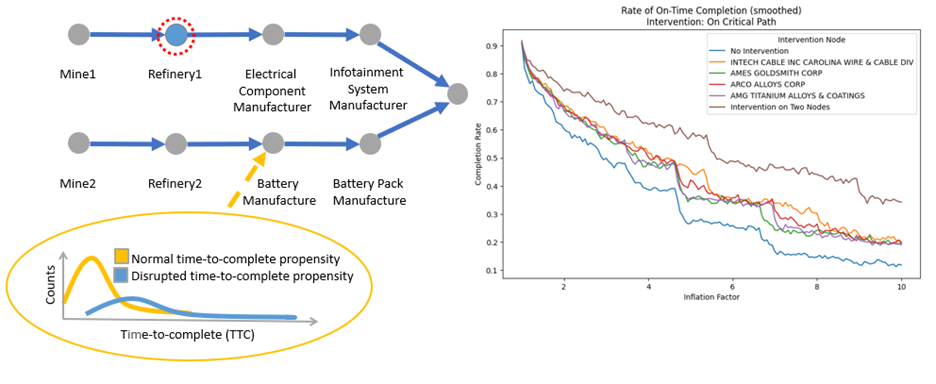
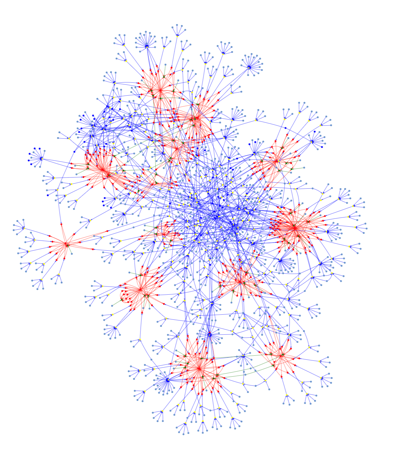
Expanding the analytical methodologies for network resilience would enable better planning for system management before a disruption, as it is occurring, and in the immediate aftermath. Improved system resilience will decrease the time that a system cannot provide its critical function according to its purpose in broader society.